Ambition looks different in different places. In some states, it shows up as new businesses launching at a rapid pace. In others, it’s reflected in advanced degree attainment, a growing graduate student population or a strong pipeline of those entering skilled careers.(See disclaimer 1,2,5,6)
To better understand where these signals are strongest, we built an Ambition Index that ranks U.S. states (plus Washington, D.C.) using 11 indicators across four themes:(See disclaimer 1-7)
Read on to see what we found.
Reflected in graduate degree enrollment and new business growth
Key Findings
What Is the Ambition Index?
The Ambition Index ranks states based on indicators tied to learning, building and economic momentum.
To keep comparisons fair across very different states, several measures were expressed per capita (for example, patents issued per 100,000 people and business applications per 100,000 residents). Each metric was then standardized, allowing all 11 indicators to be combined into a single score.(See disclaimer 2,7)
The final output is a composite score (0–100) and a ranked list from most ambitious to least ambitious.(See disclaimer 1-7)
The 10 Most Ambitious States
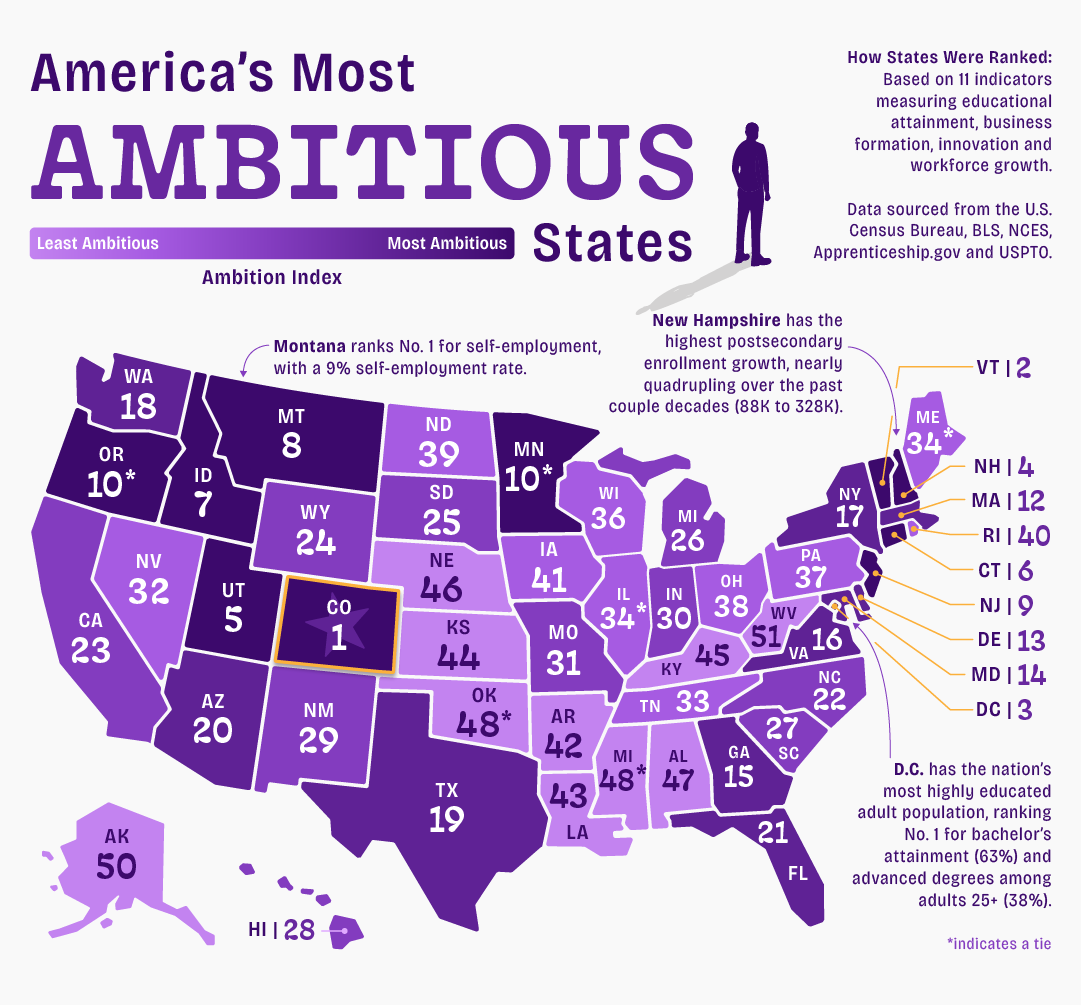
Here are the top-performing states on the Ambition Index. (* indicates a tie.)(See disclaimer 1-7)
1. Colorado
2. Vermont
3. District of Columbia
4. New Hampshire
5. Utah
6. Connecticut
7. Idaho
8. Montana
9. New Jersey
10. Oregon*
10. Minnesota*
Where Arizona Ranks
Arizona ranks No. 20 overall with an Ambition Index score of 52.1, placing it above the national average score in this study, 45.6.(See disclaimer 1-7)
Arizona’s strongest signals come from the “pipeline” side of ambition — the systems that build skills and support growth:(See disclaimer 2,5)
Category Leaders: Who Stands Out and Why?
Looking at the category leaders helps explain what sits beneath the overall ranking. Some states stand out because they dominate a single signal of ambition, such as patents, apprenticeships or postsecondary enrollment growth, while others place highly by showing balanced strength across several indicators at once. That contrast helps explain why leading one category does not always translate to a top 10 overall finish.(See disclaimer 1-7)
Here are the top performers by individual metric:
Closing Thoughts
Rankings like this are most useful when they spark questions such as: What’s driving opportunity in a state? and What can individuals do to participate in it? Whether ambition manifests through higher education, entrepreneurship or workforce momentum, the common thread is investing in skills and turning them into practical impact.
Arizona’s position in the top half of the index reflects a state that’s building forward in key areas, including postsecondary enrollment growth and business formation. For learners at every stage, understanding these state-level trends can help connect education choices to emerging career needs.(See disclaimer 2,5)
For those looking to build on that momentum, pursuing higher education can be one way to develop the knowledge and practical experience needed in growing industries. Grand Canyon University offers online degree programs designed to help you build career-ready skills and pursue opportunities in Arizona’s evolving economy.
Methodology
The Ambition Index ranks U.S. states (plus Washington, D.C.) using 11 indicators that reflect four dimensions of statewide ambition: educational attainment, entrepreneurship, innovation and workforce momentum. Data was pulled from official public sources, including the U.S. Census Bureau, U.S. Bureau of Labor Statistics, NCES IPEDS, Apprenticeship.gov and USPTO PatentsView, using the most recent state-level data available for each measure.(See disclaimer 1-7)
To make metrics comparable across states, each indicator was standardized and converted into a factor score. Indicators were then weighted based on how strongly they signal ambition, with the greatest emphasis placed on innovation and entrepreneurship (especially patents issued per 100,000 residents and business applications per 100,000 residents). Unemployment was inverted so that lower unemployment contributed to a higher score. Weighted factor scores (weights summing to 20) were combined and scaled into a 0–100 composite index and states were ranked from highest to lowest.(See disclaimer 1-7)
Fair Use
You are welcome to use, reference and share non-commercial excerpts of this study with proper attribution. If you cite or cover our findings, please link back to this page so readers can view the full methodology, charts and context.