


Quantitative data collection methods are the methodologies that a researcher may use to collect quantitative data for a study. Focusing on numerical data, researchers can use these effective methods to gather large datasets. If you’re thinking of pursuing a doctoral degree and you want to conduct quantitative data research, you may use multiple methods of collecting your data.
If you join the doctoral community at GCU, you’ll have plenty of support as you conduct original research for your dissertation. Your dissertation chair can offer guidance as you choose the most effective data collection methods for your research. You’ll also have the support of the Doctoral Community (DC) Network™ at College of Doctoral Studies.
What Is Quantitative Data?
Quantitative data refers to data that are expressed in numeric form. According to a study published in the National Library of Medicine, quantitative research strives to answer questions such as:(See disclaimer 1)
There are two primary categories of quantitative data: discrete and continuous. Discrete data are any data that cannot be further refined. For example, a family can have two or three children but not 2.5 children. Continuous data, on the other hand, can be further refined in multiple ways. For example, when taking a person’s height measurement, you can continuously refine it from feet to inches to centimeters to millimeters.
You can collect discrete or continuous data in numerous forms. Consider the following quantitative data examples:
Once you have an idea of the types of data you need to collect for your research, you’ll be able to pinpoint the most effective quantitative data collection methods for your work.
Quantitative Data Collection vs. Qualitative Data Collection
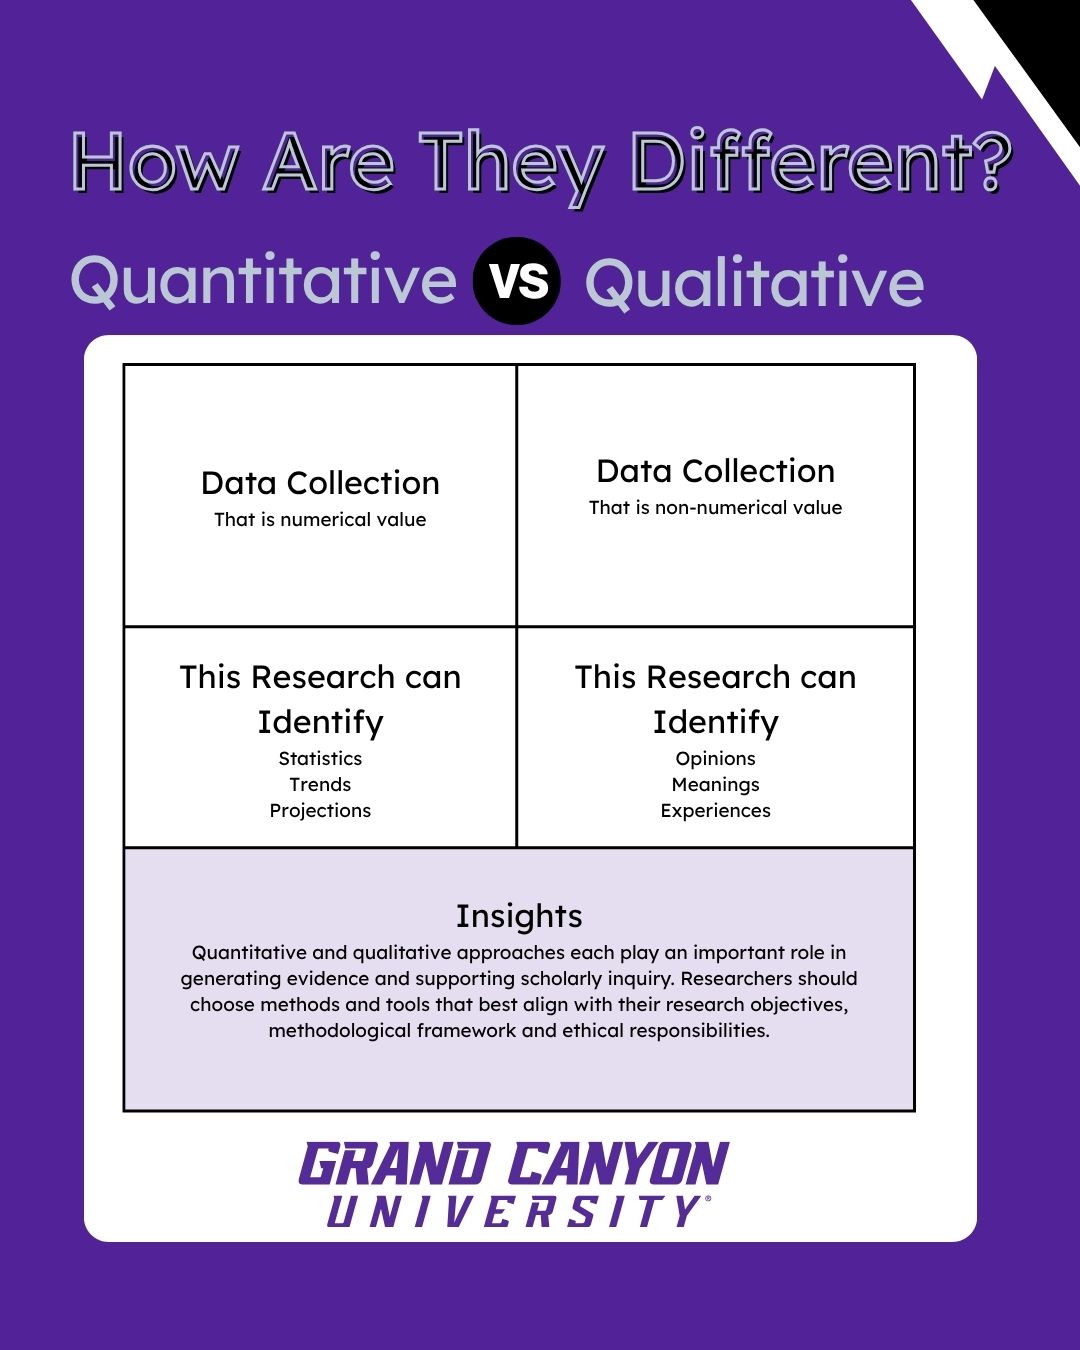
When you engage in quantitative data collection, you’ll collect information that has a numerical value. From these data, you can develop an idea of statistics, trends and projections. In contrast, when you collect qualitative data, you’ll gather non-numerical data relating to concepts such as opinions, experiences and meanings. Qualitative data is often collected during interviews, focus groups and observations, whereas quantitative data is often collected through surveys and questionnaires.
What Are Quantitative Data Collection Methods?
A quantitative method of data collection is any methodology that enables a researcher to gather together numerical data from many different sources, such as different study participants. Quantitative data collection uses a structured, empirical approach by using time-tested and widely recognized designs. Through this structured quantitative research, researchers can investigate trends and patterns, and test hypotheses.(See disclaimer 1)
When To Use Quantitative Data Collection
Both qualitative and quantitative data collection are scientifically sound approaches, but neither is necessarily appropriate for every situation. Researchers may use quantitative data collection when they need objective, measurable data to evaluate relationships between variables, identify patterns, compare outcomes or assess changes over time.(See disclaimer 1)
The Most Effective Quantitative Data Collection Methods
Students can choose from several primary methods of collecting quantitative data to shape their dissertations. This includes the following methods:
Surveys and Questionnaires
Of all the quantitative data collection methods, surveys and questionnaires are among the most straightforward and universally applicable. Many graduate students conducting doctoral research use this method because surveys and questionnaires are applicable to both quantitative and qualitative research.
You should consider a few questions when planning a survey or questionnaire. Consider these examples:
When collecting quantitative data, remember to keep your questions closed-ended rather than open-ended. Scales, multiple choice questions, yes or no questions and other types of closed-ended questions work well.
Additionally, you should be aware of the potential for unintended biases to sneak into the wording of your questions. You’ll want to avoid using any language that isn’t strictly neutral.
Consider the following example:
Note that you must ensure that your survey respondents align with your target demographic. The first few questions of your survey should strive to filter out potential participants who do not meet the inclusion criteria. For example, you might ask the respondents to indicate their age range and occupation.
Experiments and Controlled Tests
Experiments, or controlled tests, may be used to study a potential cause-and-effect relationship. A controlled experiment works much like an A/B test, in which the researcher manipulates one variable to determine whether it causes a change in a different variable. Keep in mind that the results may not necessarily generalize well to broader situations or different contexts.
An example of a controlled experiment is a market researcher launching two landing pages aimed at potential customers. Both landing pages feature the exact same text and layout. However, they have a different color scheme. In this example, the market researcher is testing whether a particular color scheme makes a product or service more or less attractive to customers by comparing number of page visits, time on the page and conversions.
Systemic Observation
Sometimes, researchers must visit a particular environment and make specific observations to inform their dissertation analyses. Like interviews, observations can be used to collect either quantitative or qualitative data. For quantitative data, researchers will generally conduct structured or systemic observations.
To conduct structured observations, you will first identify the specific behaviors on which you intend to focus. Then, you will record those behaviors as they happen. This process will produce your calculations (e.g., how many times a particular event happens).
Let’s go back to the previous hypothetical example of conducting research in the field of education. Perhaps your goal is to evaluate the effectiveness of incentives in the special education classroom. In collaboration with a teacher, you might visit a special education classroom and sit quietly in a corner to observe the class.
Because you have identified the behaviors of interest and consulted with the teacher, you know that at some point during your observation, the teacher will announce to the class that every student who is able to focus on an assignment for 15 minutes without being distracted will receive a lollipop. As the students start working, you’ll count the number of times they look away from their assignments. You might also decide to count the number of times a student gets up from their desk.
Of course, for an accurate experiment, you’ll need to study multiple groups of participants. This means that you’ll need to visit another special education classroom where the teacher does not offer a lollipop reward but still announces to the class that the students are expected to work for 15 minutes without distraction. This would allow you to compare the number of distracted behaviors exhibited by one group of students to the number of distracted behaviors exhibited by the second group.
You’ll also need a control group. For this, you would visit a third special education classroom where the teacher distributes an assignment but does not announce expected behaviors. You’ll count the number of distracted behaviors in this control group.
Online Polling
The internet can facilitate your research. You can conduct digital polls, which enables you to access a large volume of study participants. Much like other types of surveys, you’ll need to include demographic questions to screen out study participants who don’t fit your criteria. You’ll then need to ask closed-ended questions, such as multiple-choice questions.
For example, you might conduct a poll among office workers ages 21 to 30 to explore the factors that may contribute to or detract from their satisfaction at work. You would ask a series of questions about their work habits and about their anticipated response to different variables, such as whether a positive work culture would make them happier on the job.
Secondary Data and Existing Datasets
Quantitative research may use primary or secondary data. Primary data is original research that collects new data, whereas secondary data is research conducted on datasets that already exist. Researchers using secondary datasets won’t use their own data collection methodology, but will instead use existing information.
You might use a secondary dataset if one already exists that fulfills all of your research criteria. For example, researchers who work on medical education research frequently use secondary datasets to test new hypotheses or study predicted outcomes.(See disclaimer 1)
Common Quantitative Data Collection Tools and Instruments
There are a number of tools that researchers can use to collect quantitative data. These include:
How To Collect Quantitative Data Step-by-Step
The process of collecting quantitative data is fairly straightforward. Your first step is to identify your research goals and design. What do you hope to accomplish? Write research questions and consider the variables that may affect your data.
Next, depending on the design, choose one or more data collection methods. The collection method you should choose depends largely on what you hope to accomplish. For example, if you wish to test whether a cause-and-effect relationship exists, you might turn to a controlled experiment. If you’d like to measure trends, consider surveys and polls. If you’d like to measure behaviors, consider an observational approach.
The third main step is to refine your tools. If you’re using a survey, for example, you’ll need to develop your questions and the answer choices. Next, you might test your survey or other data collection method on a small group of study participants to determine if there are any problems or if any questions require refinement.
Lastly, initiate your data collection. Keep careful track of all the data you collect, checking for problems like duplicative entries.
Benefits of Quantitative Data Collection
Collecting quantitative data for your research project can offer numerous benefits. According to Quantilope, these include:(See disclaimer 2)
Quantitative data collection can also allow for a straightforward analysis of the data. For example, you can easily pinpoint trends by determining that a significant portion of study participants answered in a certain way.
Challenges and Limitations of Quantitative Data Collection
Despite the benefits of the quantitative method of data collection, it does have drawbacks. Quantitative data can show trends, for example, but it doesn’t offer potential reasons behind the trends. In other words, it doesn’t answer Why?
Quantitative data collection methods are also rigid. By only asking closed-ended questions, for example, researchers may miss out on nuanced responses. These methods, including surveys, also frequently rely on study participants to respond honestly and to accurately remember their experiences.
Best Practices for Reliable Quantitative Data Collection
When conducting quantitative research, it’s important not to initiate your design too quickly. Take the time to reflect on the questions you’ve developed and other aspects of the study design. Ensure that your study is approved by the university’s Institutional Review Board (IRB), which provides ethics assurance.
You should also consider whether:
Explore Quantitative Doctoral Programs at GCU
At GCU, you can pursue a doctoral degree with a quantitative research focus across a variety of disciplines. Explore quantitative programs within PhD, DBA, DHA and EdD pathways, as well as other doctoral options designed to help you develop advanced research and analytical skills in your field.
Contribute Research to Your Field
Learn more about GCU’s quantitative doctoral programs and explore the degree options available to support your academic and professional goals.


