GCU Logo Mobile
Apply NowRequest Info
  • GCU Login
GCU LoginRequest Info
Grand Canyon University logo in bold purple uppercase text on a white background
  • Degree Programs
    • Areas of Study
      • Business
      • Teaching
      • Language
      • Counseling
      • Psychology
      • Healthcare
      • Nursing
      • Criminal Justice
      • Legal Studies
      • Engineering
      • Science
      • Technology
      • Theology
      • Ministry
      • Digital Arts
      • Digital Media
      • Fine Arts
    • Locations
      • Campus
      • Online
      • Evening
    • Degree Level
      • Bachelor's
      • Master's
      • Doctoral
      • Certificates
      • Bridge
      • Post-Master's
    • Other Course Options
      • Minors
      • Individual Courses
      • High School Dual Enrollment
      • Current Teacher Continuing Education
      All Majors & Programs
      All Majors & Programs
  • Academics
    • Colleges
      • Doctoral
      • Arts & Media
      • Business
      • Education
      • Engineering & Technology
      • Humanities & Social Sciences
      • Natural Sciences
      • Nursing & Health Care
      • Theology
      • Honors
    • More About GCU
      • Academic Catalog & Policies
      • University Accreditation & Regulation
      • Educational Alliances
      • Faculty Directory
      • Office of Assessment
      • Provost Message
      Academics
      Academics
  • Admissions
    • Admissions
      • Admission Requirements
      • Visit Campus
      • Undergraduate Admissions
      • College Transfer Center
      • Graduate & Doctoral Admissions
      • Campus Resources
      Admissions
      Admissions
  • Tuition & Financial Aid
    • Tuition
      • Online & Evening
      • On-Campus
      • Housing & Meal Costs
      • Other Fees
      • Cost of Attendance
    • Financial Aid
      • FAFSA
      • Scholarships & Grants
      • Student Loans
      Tuition & Financial Aid
      Tuition & Financial Aid
  • Why GCU
    • Student Journey
      • Online Learning
      • Campus Life
      • Evening Classes
      • Hybrid Learning
      • Military & Veteran
      • ROTC
      • International Students
      • Native American
    • Our Story
      • University Spirit & Traditions
      • Christian Identity & Mission
      • History & Campus Growth
      • Community Outreach
    • About
      • Leadership Team
      • Campus Locations
      • Blog
      • Offices
      • Contact
      • Media & Branding
      Why GCU
      Why GCU
Apply NowRequest Info

Read time 5 minutes

Published on Jul 28, 2020


In This Article
  • Overview
In This Article
Overview
Tags
Career Corner
Related Resources

Online Degrees
Admission
Scholarships & Grants
Transfer Center
Unlock Your Potential

Speak with a University Counselor today.

Apply Now
Related Articles In
GCU Experience
Two teenage ballet dancers waiting to go on stage.

How To Overcome Performance Anxiety in the Arts

Performance anxiety can affect all types of performers. Discover strategies to manage stage fright and grow your confidence through GCU’s arts programs.

11/05/2025

|

5 min read

Student sitting on a couch at home, working on a laptop with headphones around neck, representing remote college application trends in 2025.

College Admission Trends for 2025: What Students Should Know

Get ahead with a look at college admissions trends for 2025. Learn what’s changing, how to prepare and when to start your application.

11/03/2025

|

6 min read

GCU students studying together outdoors with laptops and tablets on GCU campus, representing future-focused college majors and collaboration.

Best College Majors for the Future

Discover the best college majors for the future, from technology and healthcare to sustainability and business. Explore growing fields and apply to GCU to prepare for tomorrow’s workforce.

10/30/2025

|

6 min read

The views and opinions expressed in this article are those of the author’s and do not necessarily reflect the official policy or position of Grand Canyon University. Any sources cited were accurate as of the publish date.

We're here to help.

I'm Ready to ApplyI Need More Information
GCU Logo White
1-855-GCU-LOPELive Chat
3300 West Camelback Road  - 
Phoenix, AZ 85017
Grand Canyon University © 2025
All Rights Reserved
  • Majors & Programs
  • Admission
  • Financial Resources
  • Academic Calendar
  • Academic Catalog & Policies
  • Online Learning
  • Why GCU
  • Contact Us
  • Careers
  • Title IX
  • Media & Licensing
  • Consumer Information
  • Financial Disclosures
  • Privacy Policy
  • Cost of Attendance
Find Your Purpose Logo
Video from GCU
FacebookTwitter/XLinkedInInstagramYouTube
  • Current Students
    |
  • Alumni
    |
  • Athletics
    |
  • Arena
    |
  • GCU News
    |
  • Lope Shops
    |
  • GCBC
    |
  • Canyon Promotions
    |
  • Lope House
    |
  • GCU Golf

Privacy / Cookie Disclaimer: Our site uses cookies to personalize content, to provide social media features/ads and to analyze site traffic. We share information about your use of this site with our social media, advertising and analytics teams who may combine it with other information that you’ve provided to them. By continuing to navigate this site you are consenting to the collection of information via our use of cookies. For more information on our cookie collection and use please visit our Privacy Policy.

Share This Story
FacebookTwitter/XLinkedInShare via Email

  1. Home/
  2. Blog/
  3. GCU Experience/
  4. US Unemployment Rates By Year and State

US Unemployment Rates By Year and State

US Unemployment Rates By Year and State chart
Start your GCU
journey today.
Step 1: Educational Interests
This helps us connect you with the right enrollment counselor to help you through the process.
Make a selection
Select One
Bachelor's
Master's
Doctoral
Bridge
Make a selection
First select a degree level
Make a selection
First select a degree level and how you would like to attend
Make a selection
First select degree level, modality, and area of interest
Make a selection
Select One
Yes
No
Make a selection
Select One
Yes
No
Make a selection
Select One
Yes
No
West Valley (Phoenix, AZ) ABSN
Select One
Albuquerque, NM ABSN
Boise (Meridian, ID) ABSN
Denver (Englewood, CO) ABSN
East Valley (Chandler, AZ) ABSN
Las Vegas (Henderson, NV) ABSN
Miramar (Miami, FL) ABSN
Orlando (Lake Mary, FL) ABSN
Salt Lake (Sandy, UT) ABSN
St. Louis, MO ABSN
Sun City, AZ ABSN
Tucson, AZ ABSN
West Valley (Phoenix, AZ) ABSN
Make a selection
Select One
Still in High School
High School Diploma or GED
Some College
Associate Degree or over 60 credits
Bachelor's Degree
Master's Degree or Higher
Bachelor's with Cert. & Experience
BS in Nursing
Make a selection
Select One
2029
2028
2027
2026
2025
2024
2023
2022
2021
2020
2019
2018
2017
2016
2015
2014
2013
2012
2011
2010
2009
2008
2007
2006
2005
2004
2003
2002
2001
2000
1999
1998
1997
1996
1995
1994
1993
1992
1991
1990
1989
1988
1987
1986
1985
1984
1983
1982
1981
1980
1979
1978
1977
1976
1975
1974
1973
1972
1971
1970
1969
1968
1967
1966
1965
1964
1963
1962
1961
1960
1959
1958
1957
1956
1955
1954
1953
1952
1951
1950
1949
1948
1947
1946
1945
1944
1943
1942
1941
1940
1939
1938
1937
1936
1935
U.S. Citizen
U.S. Citizen
Non-U.S. Citizen
No military affiliation
Make a selection
No military affiliation
Active
Spouse
Retired
Veteran
United States
United States
Afghanistan
Albania
Algeria
American Samoa
Andorra
Angola
Anguilla
Antarctica
Antigua And Barbuda
Argentina
Armenia
Aruba
Australia
Austria
Azerbaijan
Bahamas
Bahrain
Bangladesh
Barbados
Belarus
Belgium
Belize
Benin
Bermuda
Bhutan
Bolivia
Bosnia And Herzegovina
Botswana
Bouvet Island
Brazil
British Indian Ocean Territory
Brunei Darussalam
Bulgaria
Burkina Faso
Burundi
Cambodia
Cameroon
Canada
Cape Verde
Cayman Islands
Central African Republic
Chad
Chile
China
Christmas Island
Cocos (keeling) Islands
Colombia
Comoros
Congo
Congo, The Democratic Republic Of The
Cook Islands
Costa Rica
Cote D'ivoire
Croatia
Cuba
Cyprus
Czech Republic
Denmark
Djibouti
Dominica
Dominican Republic
East Timor
Ecuador
Egypt
El Salvador
Equatorial Guinea
Eritrea
Estonia
Ethiopia
Falkland Islands (malvinas)
Faroe Islands
Fiji
Finland
France
French Guiana
French Polynesia
French Southern Territories
Gabon
Gambia
Georgia
Germany
Ghana
Gibraltar
Greece
Greenland
Grenada
Guadeloupe
Guam
Guatemala
Guinea
Guinea-bissau
Guyana
Haiti
Heard Island And Mcdonald Islands
Holy See (vatican City State)
Honduras
Hong Kong
Hungary
Iceland
India
Indonesia
Iran, Islamic Republic Of
Iraq
Ireland
Israel
Italy
Jamaica
Japan
Jordan
Kazakstan
Kenya
Kiribati
Korea, Democratic People's Republic Of
Korea, Republic Of
Kosovo
Kuwait
Kyrgyzstan
Lao People's Democratic Republic
Latvia
Lebanon
Lesotho
Liberia
Libyan Arab Jamahiriya
Liechtenstein
Lithuania
Luxembourg
Macau
Macedonia, The Former Yugoslav Republic Of
Madagascar
Malawi
Malaysia
Maldives
Mali
Malta
Marshall Islands
Martinique
Mauritania
Mauritius
Mayotte
Mexico
Micronesia, Federated States Of
Moldova, Republic Of
Monaco
Mongolia
Montenegro
Montserrat
Morocco
Mozambique
Myanmar
Namibia
Nauru
Nepal
Netherlands
Netherlands Antilles
New Caledonia
New Zealand
Nicaragua
Niger
Nigeria
Niue
Norfolk Island
Northern Mariana Islands
Norway
Oman
Pakistan
Palau
Palestinian Territory, Occupied
Panama
Papua New Guinea
Paraguay
Peru
Philippines
Pitcairn
Poland
Portugal
Puerto Rico
Qatar
Reunion
Romania
Russian Federation
Rwanda
Saint Helena
Saint Kitts And Nevis
Saint Lucia
Saint Pierre And Miquelon
Saint Vincent And The Grenadines
Samoa
San Marino
Sao Tome And Principe
Saudi Arabia
Senegal
Serbia
Seychelles
Sierra Leone
Singapore
Slovakia
Slovenia
Solomon Islands
Somalia
South Africa
South Georgia And The South Sandwich Islands
Spain
Sri Lanka
Sudan
Suriname
Svalbard And Jan Mayen
Swaziland
Sweden
Switzerland
Syrian Arab Republic
Taiwan, Province Of China
Tajikistan
Tanzania, United Republic Of
Thailand
Togo
Tokelau
Tonga
Trinidad And Tobago
Tunisia
Turkey
Turkmenistan
Turks And Caicos Islands
Tuvalu
Uganda
Ukraine
United Arab Emirates
United Kingdom
United States
United States Minor Outlying Islands
Uruguay
Uzbekistan
Vanuatu
Venezuela
Viet Nam
Virgin Islands, British
Virgin Islands, U.s.
Wallis And Futuna
Western Sahara
Yemen
Zambia
Zimbabwe

By clicking submit, you give GCU consent to use automated technology to call and text you regarding educational services. Your consent is not required to receive educational services. GCU will never sell your information. By submitting this form, you agree to GCU's privacy policy.

America’s unemployment rate is a near-constant part of the country’s political and economic discourse. But as a result of the COVID-19 pandemic, unemployment has an even bigger spotlight. Millions around the United States have lost their jobs due to the number of businesses that were forced to close or reduce staff in an effort to keep people safe and healthy.

As an institute of higher learning that prepares students for careers in many different fields, here at Grand Canyon University we have a vested interest in employment trends in America. Even before the Coronavirus hit and thrust unemployment to the top of the news, our team was undertaking a detailed study of how unemployment has changed across the nation over the decades. Once the pandemic took hold, we decided our research could help contextualize the current situation while also achieving the initial goal of illustrating how the economy and employment can vary from one state to the next.

With that in mind, we turned our data into a series of maps and graphics that illustrate some of the most interesting findings from our analysis.

chart explaining unemployment rates over time

To give additional information and context to some of America’s more recent past as it relates to unemployment, we also created this timeline focusing on the period from 1976 to the present. At various points, we have made annotations outlining world events and the impact they had on the economy and unemployment.

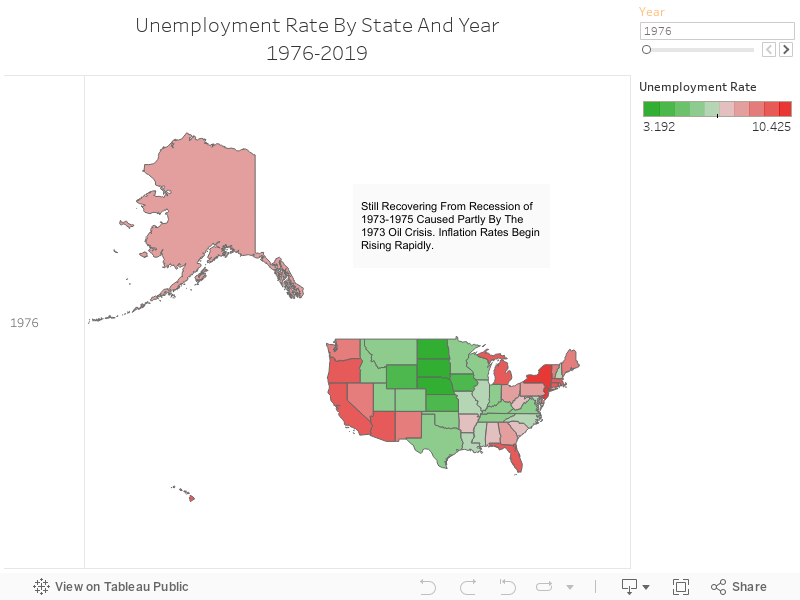
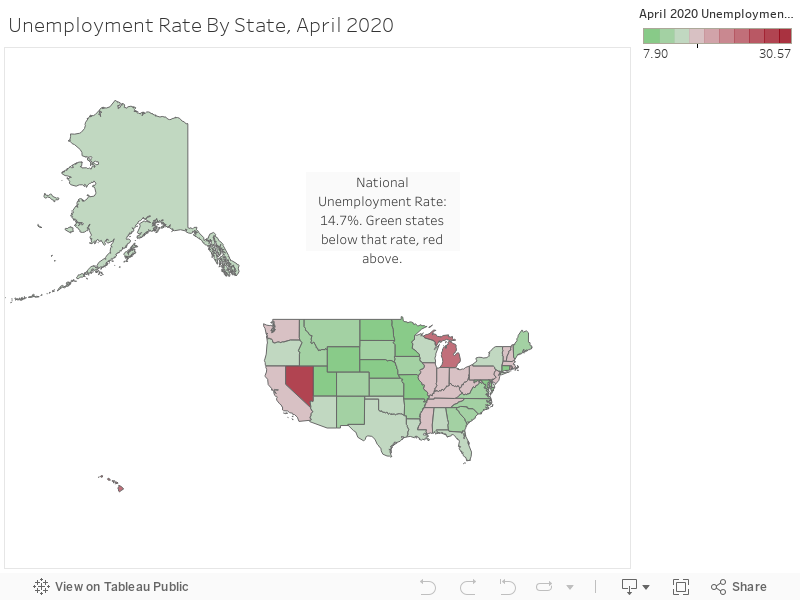
We were able to find detailed data on the unemployment rate in every state for the same period of time as the second graphic above, 1976-2019, from the Bureau of Labor Statistics. We turned that data into the interactive map above. Users can hover over any one state to see their unemployment rate in a given year, and they can change years using the arrows or slider in the upper, right-hand corner. States are color-coded every year so that those with a lower unemployment rate relative to the rest of the states are in green, and those with higher rates are in red. We also produced a map of similar data focusing solely on April 2020’s coronavirus-related unemployment rates.

bar graph infographic showing states with the most occurrences of highest or lowest unemployment rates in the United States

We took the above data and graphed out how many times different states had either the highest or lowest unemployment rates in the country. Nebraska led the way with the lowest rate ten times, matched at that number on the unemployment side of things by West Virginia.

Part of our deep dive on this information included finding which state had the highest and lowest unemployment rate in the country in every year evaluated. To simplify that data and its presentation, we made a map for every decade since the 1980s and highlighted every state that had the highest unemployment at least once in that time in red, and every state with the lowest rate at least once in green. We also listed the highest and lowest for each year in the tables below the maps and included the specific rates for each.

map chart color coded in red and blue to show highest and lowest unemployment rates for states between 1980 and 1989


color coded map chart showing highest and lowest unemployment rates for states between 1990 and 1999
red and blue states on map chart depicting highest and lowest unemployment rates for U.S. states between 2000 and 2009
states with the highest and lowest unemployment rates for the 2010s

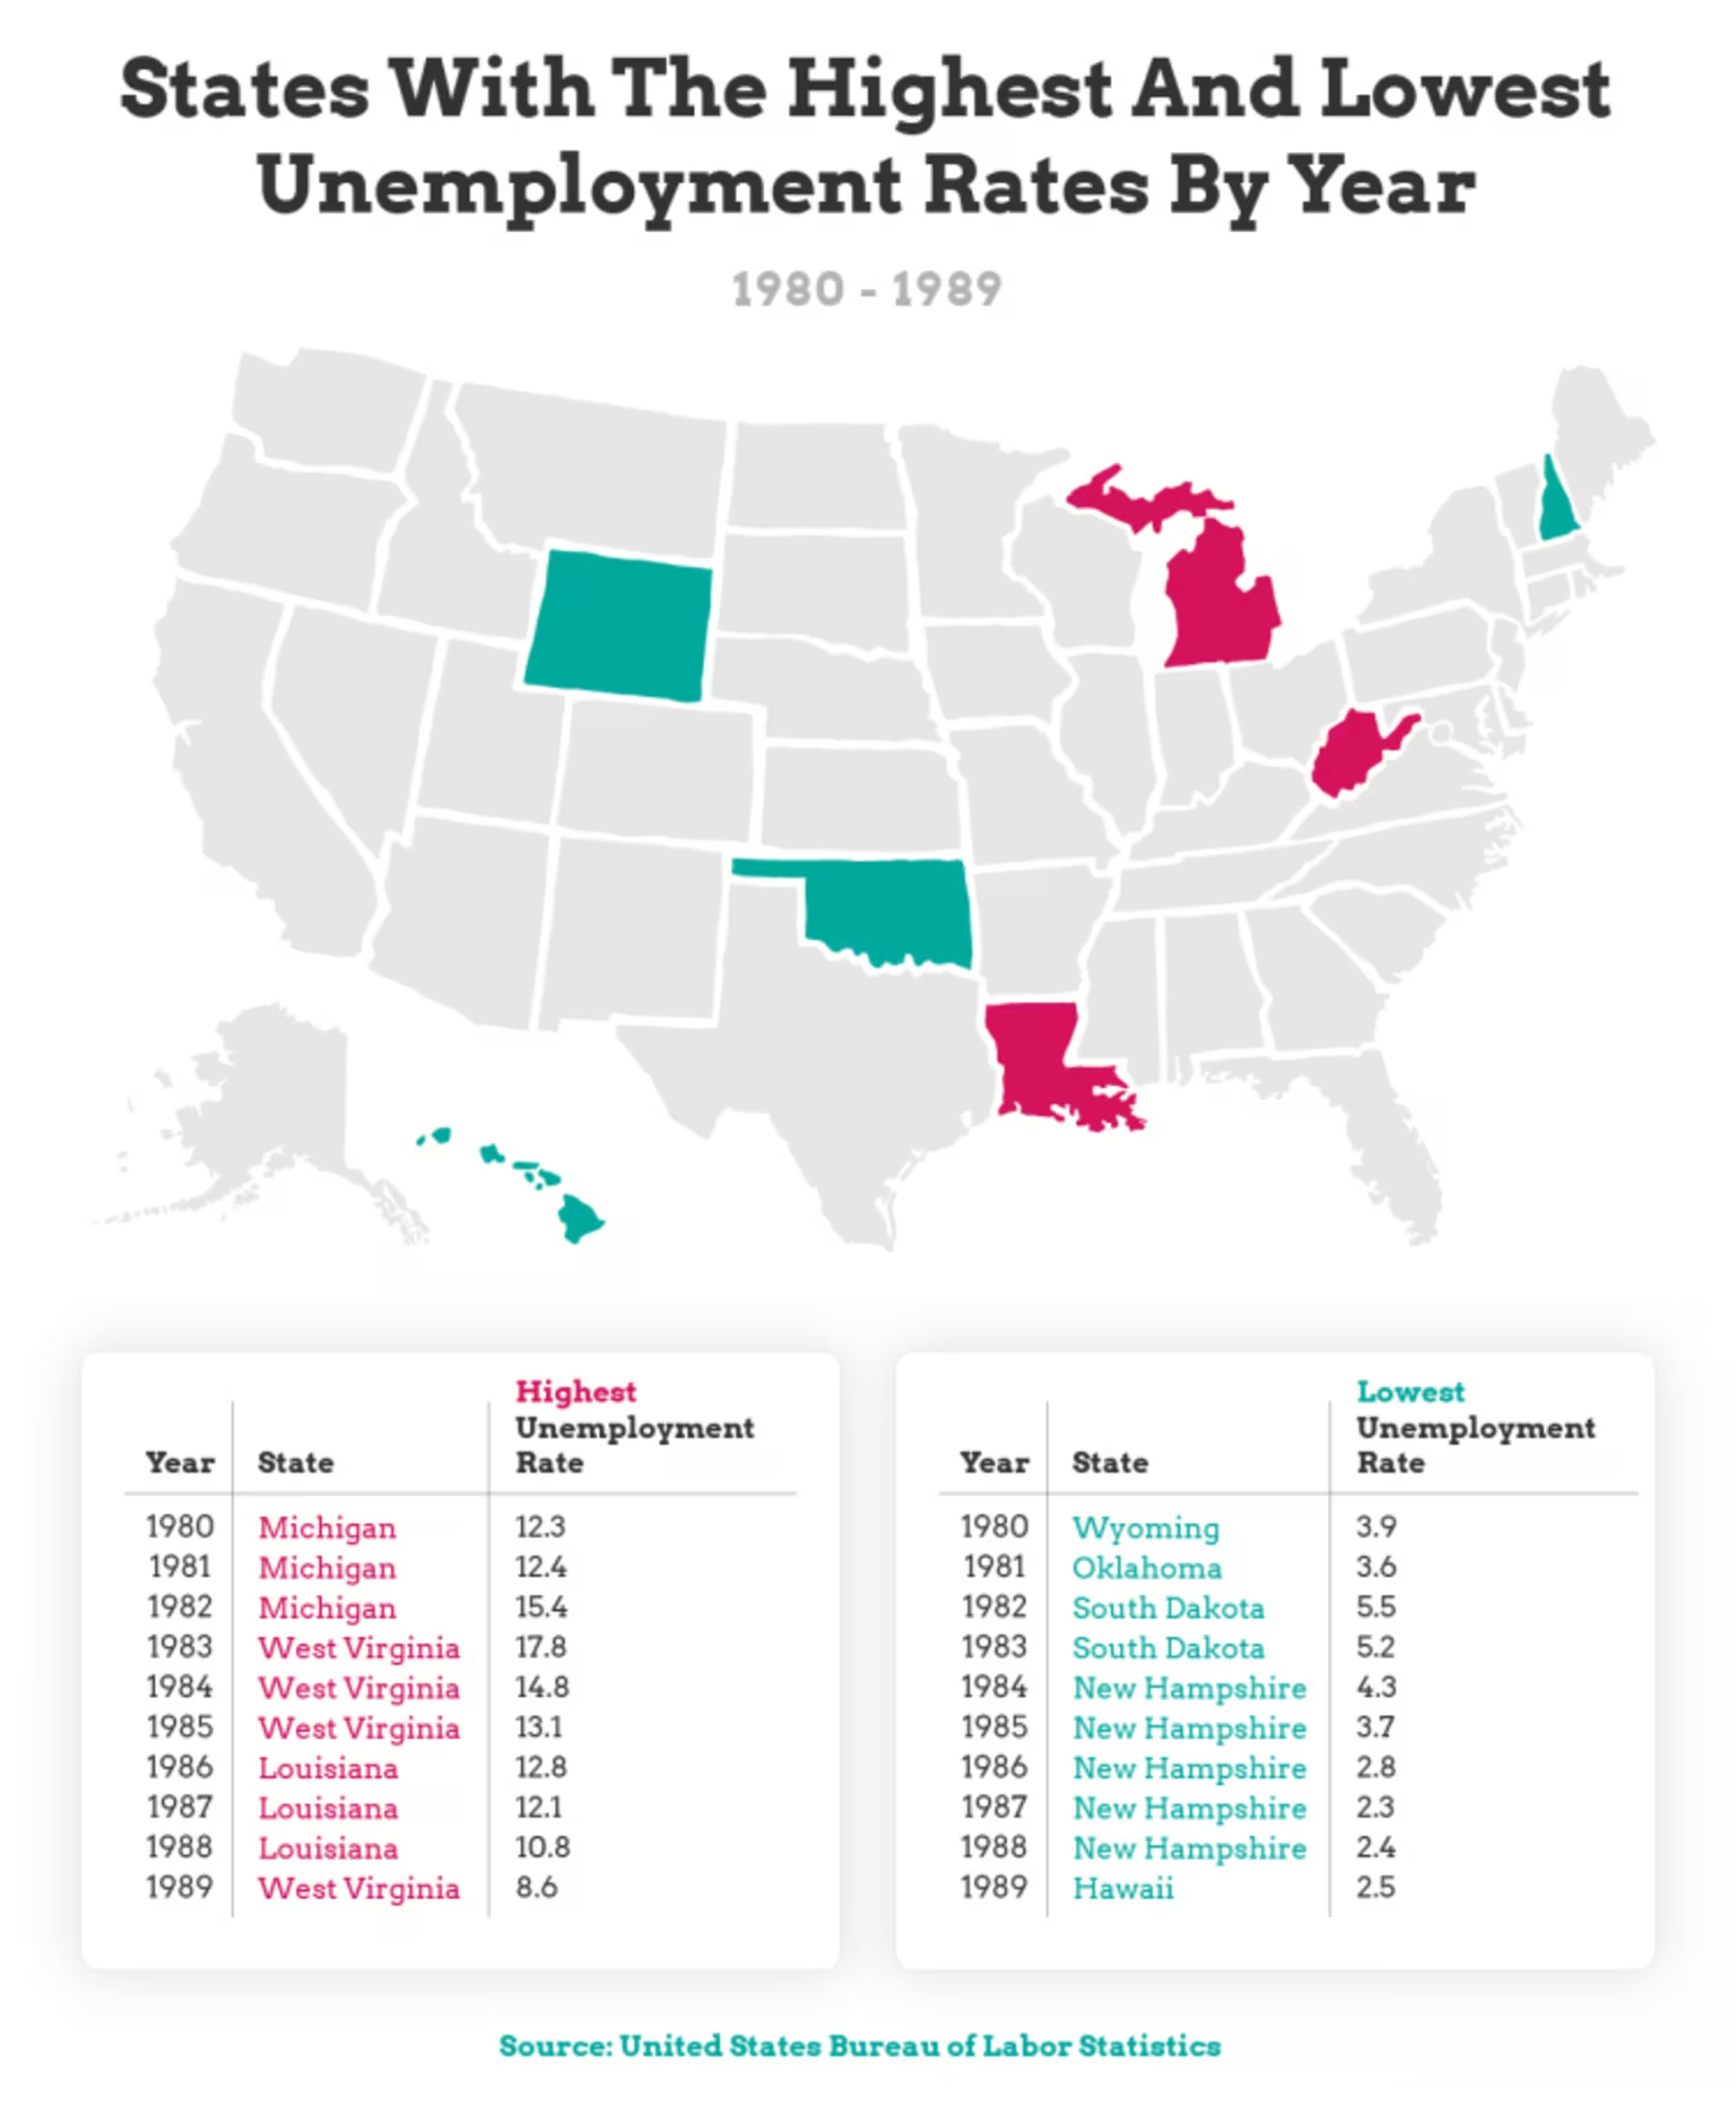
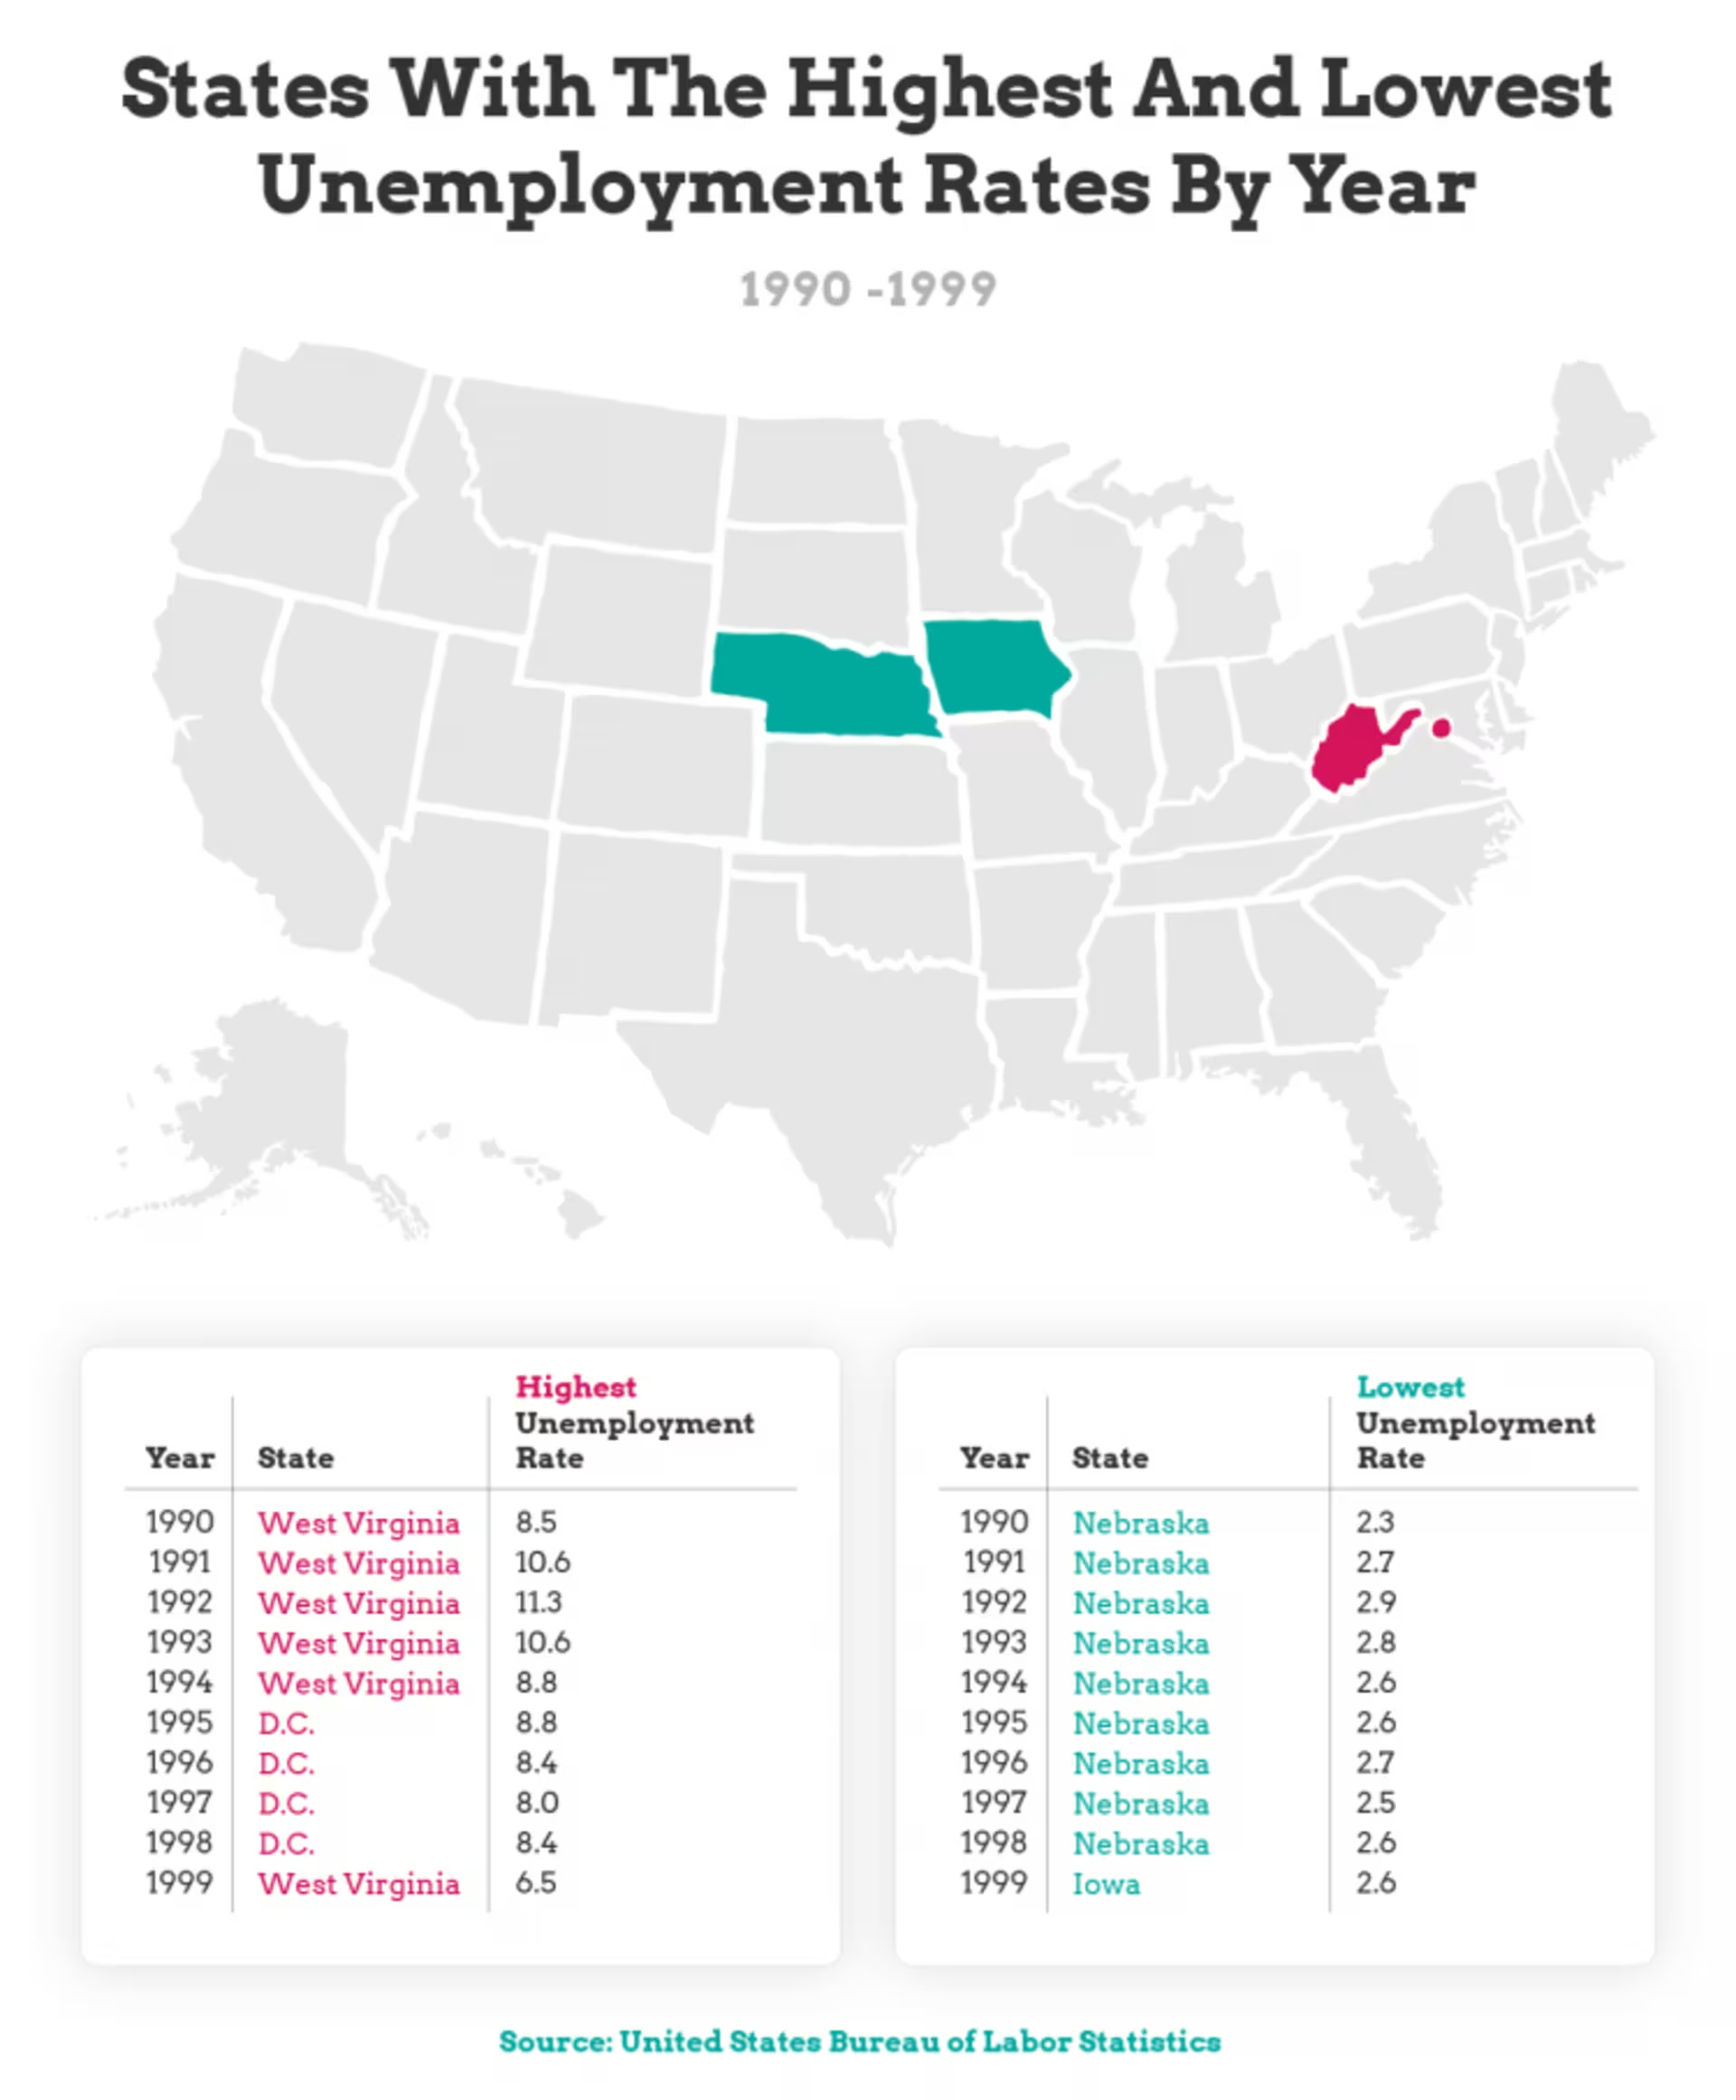
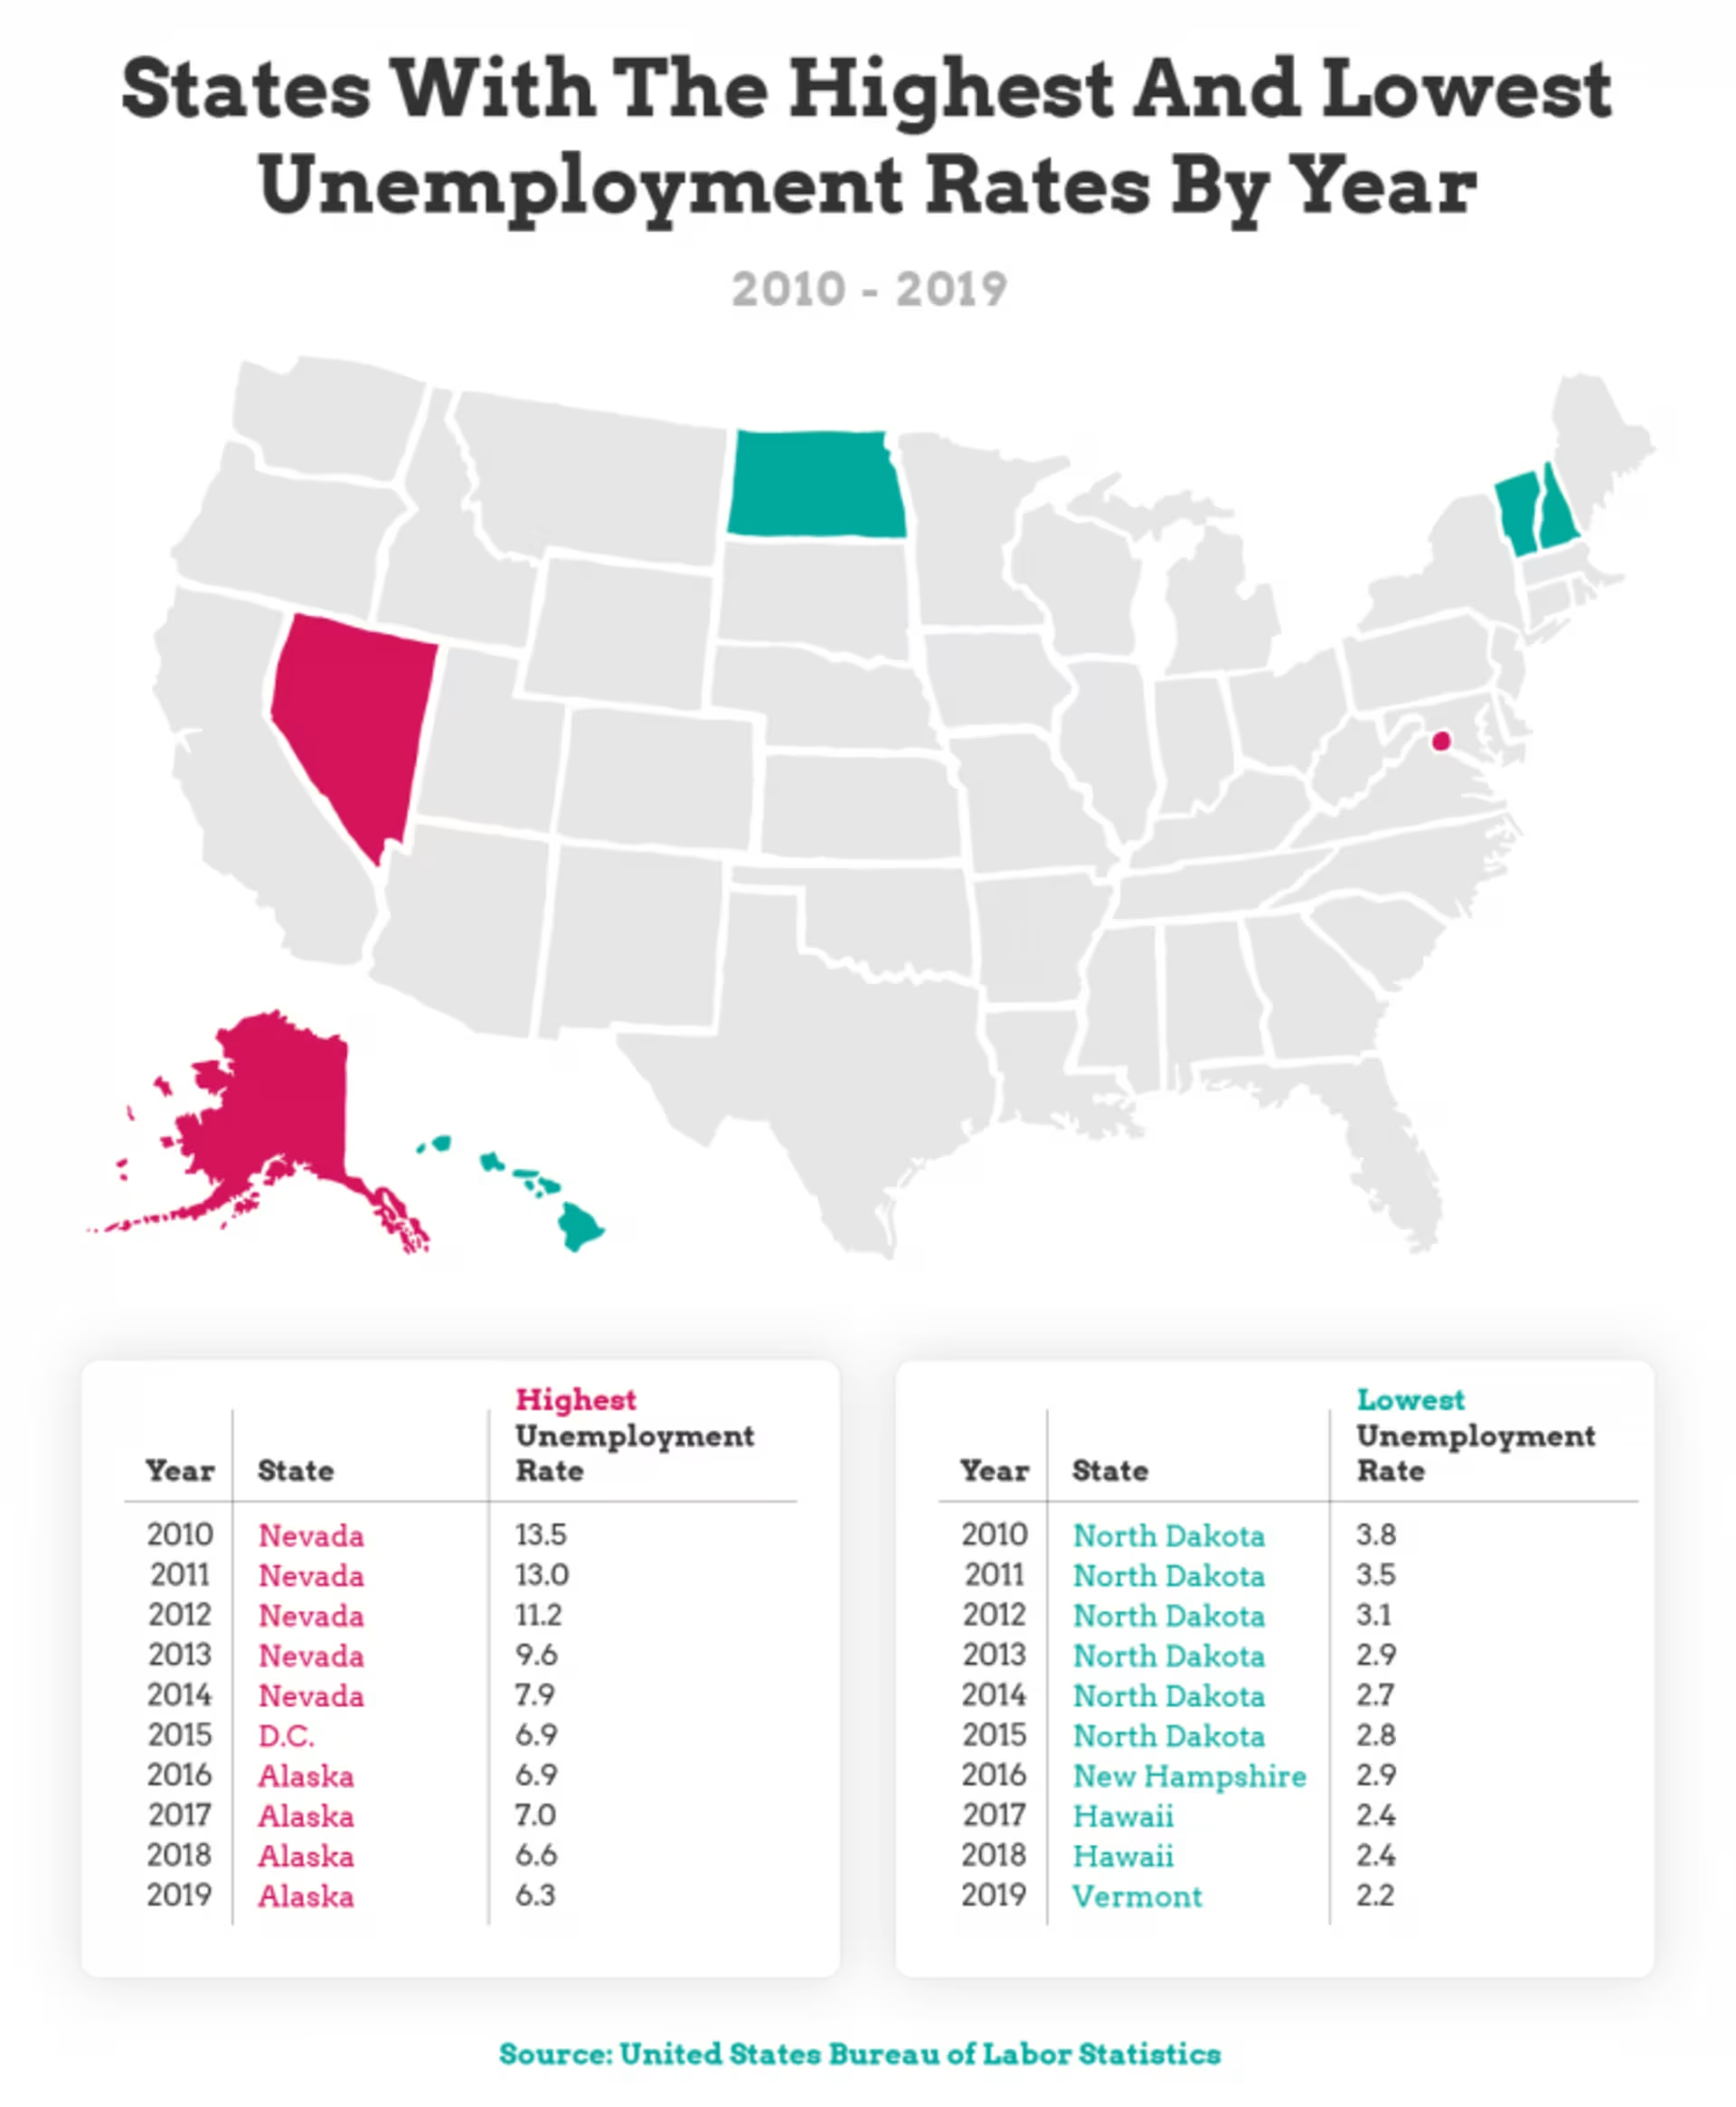
Reviewing the data this way reveals a couple of common themes. Namely, Plains states, such as Nebraska and the Dakotas, consistently have some of the lowest unemployment rates in the country, as does Hawaii. On the flip side, less populous states such as West Virginia and Alaska show up time and again with some of America’s highest unemployment rates, as do Washington, D.C. and Michigan.
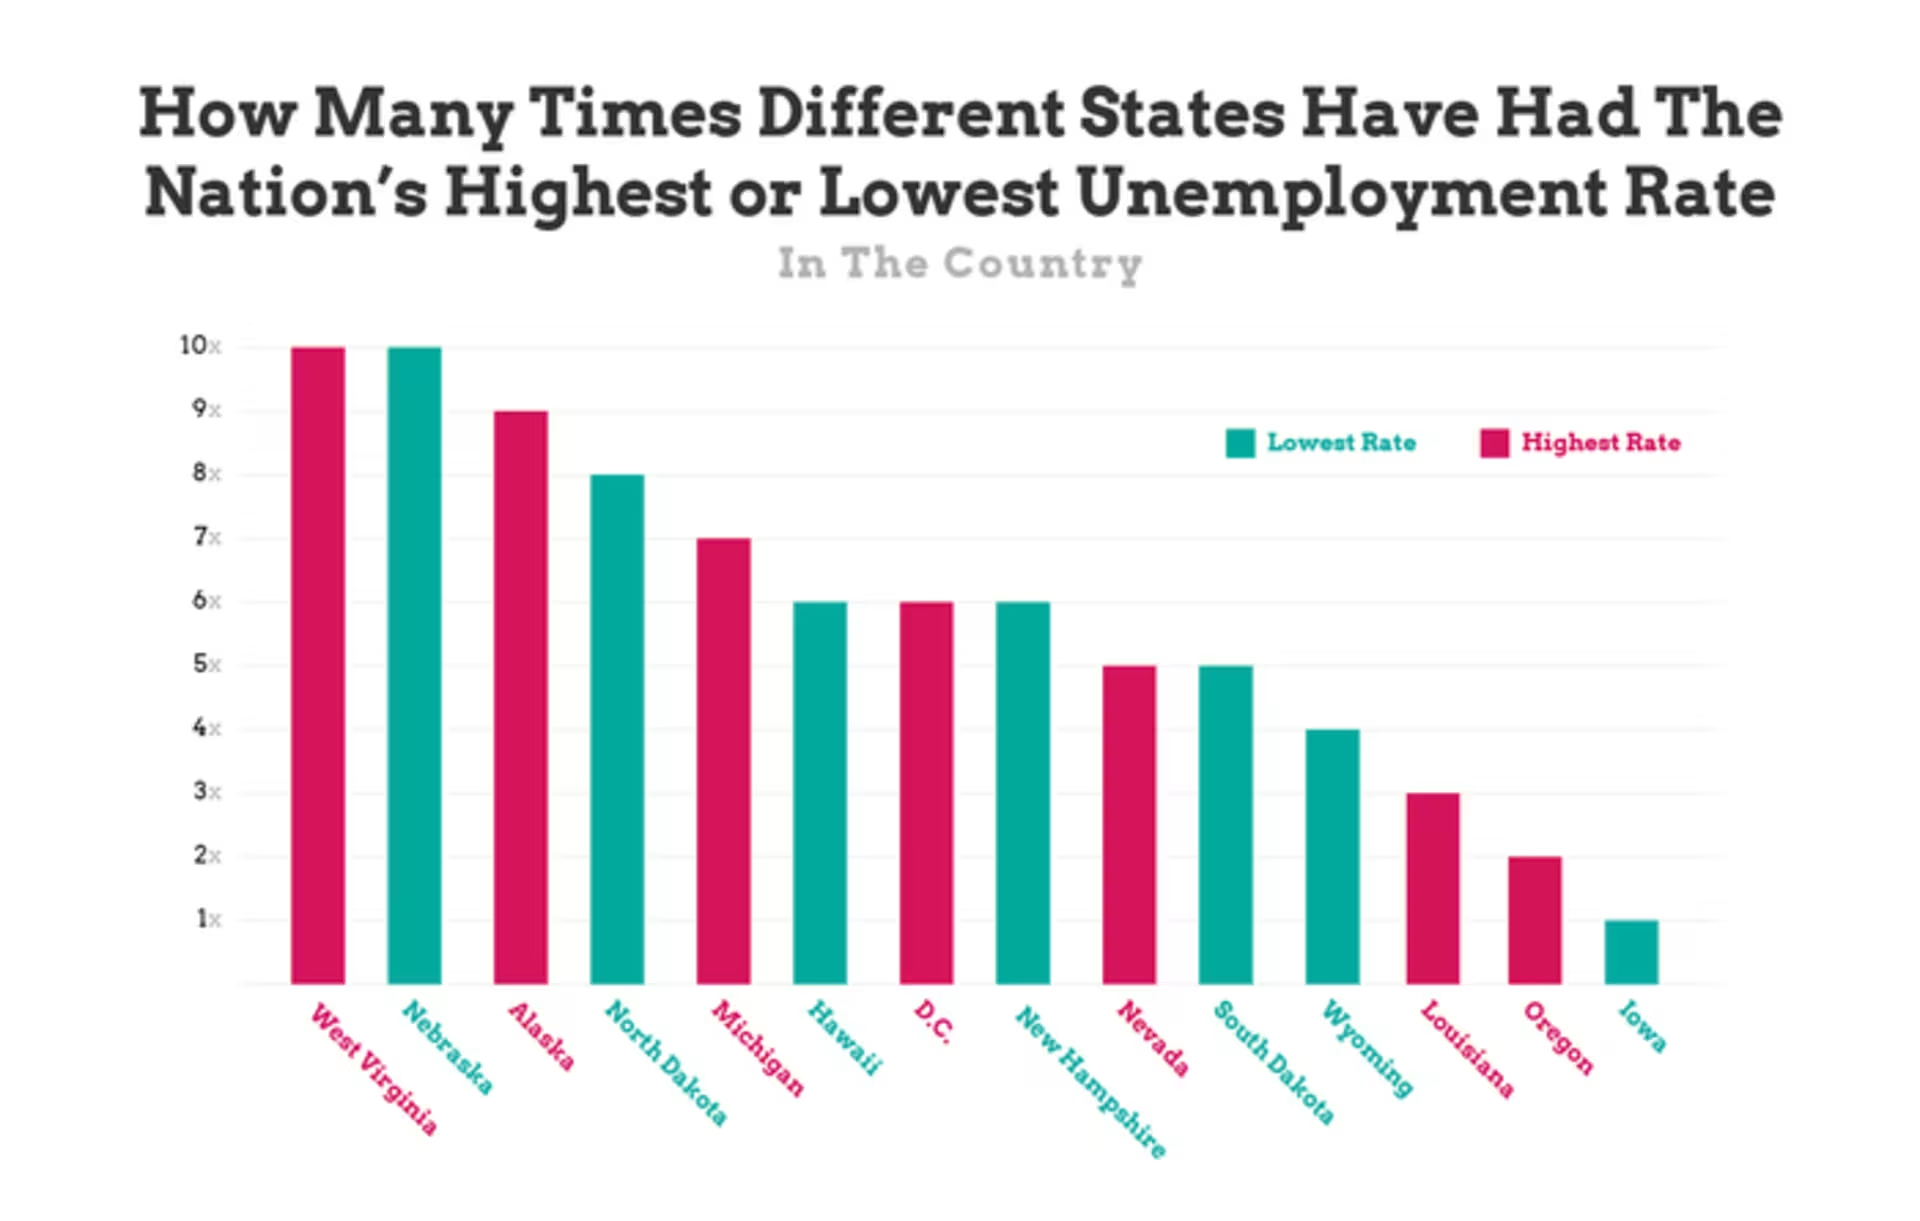
chart explaining percentages in cumulative change in unemployment rates in every state

Finally, we tracked the cumulative change in unemployment for the entire country from 1976-2019 and found the same data for every state. We then found every state with a cumulative change above or below that of the nation as a whole and marked each in the chart above. We found that the national average rate was a four percent decrease in unemployment at that time, with New Jersey having the biggest positive change, dropping their rate by 6.8 percent. The consistently low unemployment rate of Nebraska actually hurts them in this kind of evaluation, as their unemployment rate only fell by 0.2 percent over 40+ years, the lowest rate of change of the entire country.

The unemployment rate is something that will have a place in American news for the rest of our lives and beyond, with our current global situation making it all the more noteworthy. Regardless of whether you are a student looking to learn the skills necessary to begin your chosen employment journey, or someone looking to shift careers be sure to check out the different degree opportunities offered by Grand Canyon University.

line graph displaying the U.S. unemployment rate between 1970s and 2010s

The national unemployment rate is the one that typically makes the big headlines, so we wanted to make sure we took a detailed look at how that has changed over time before diving into each state individually. Using data from the Bureau of Labor Statistics going back to 1947, we were able to make the above graph showing how the unemployment rate has changed over time. Before our current crisis, the unemployment rate had not increased above 10 percent in the last 70+ years, with major job recessions in the 1980s and 2010s getting the closest to double digits.

Unemployment had been on a steady decline for the past few years and was even approaching historic lows. Then COVID-19 came into our lives. Due to the pandemic and quarantine orders put in place to save lives around the country, many businesses were forced to make budget and staffing cuts, or close entirely. As a result, the American unemployment rate jumped to the highest point ever in the time the BLS has tracked it, peaking at 14.7 percent in April 2020.

infographic chart explaining when states were above or below the national unemployment rates

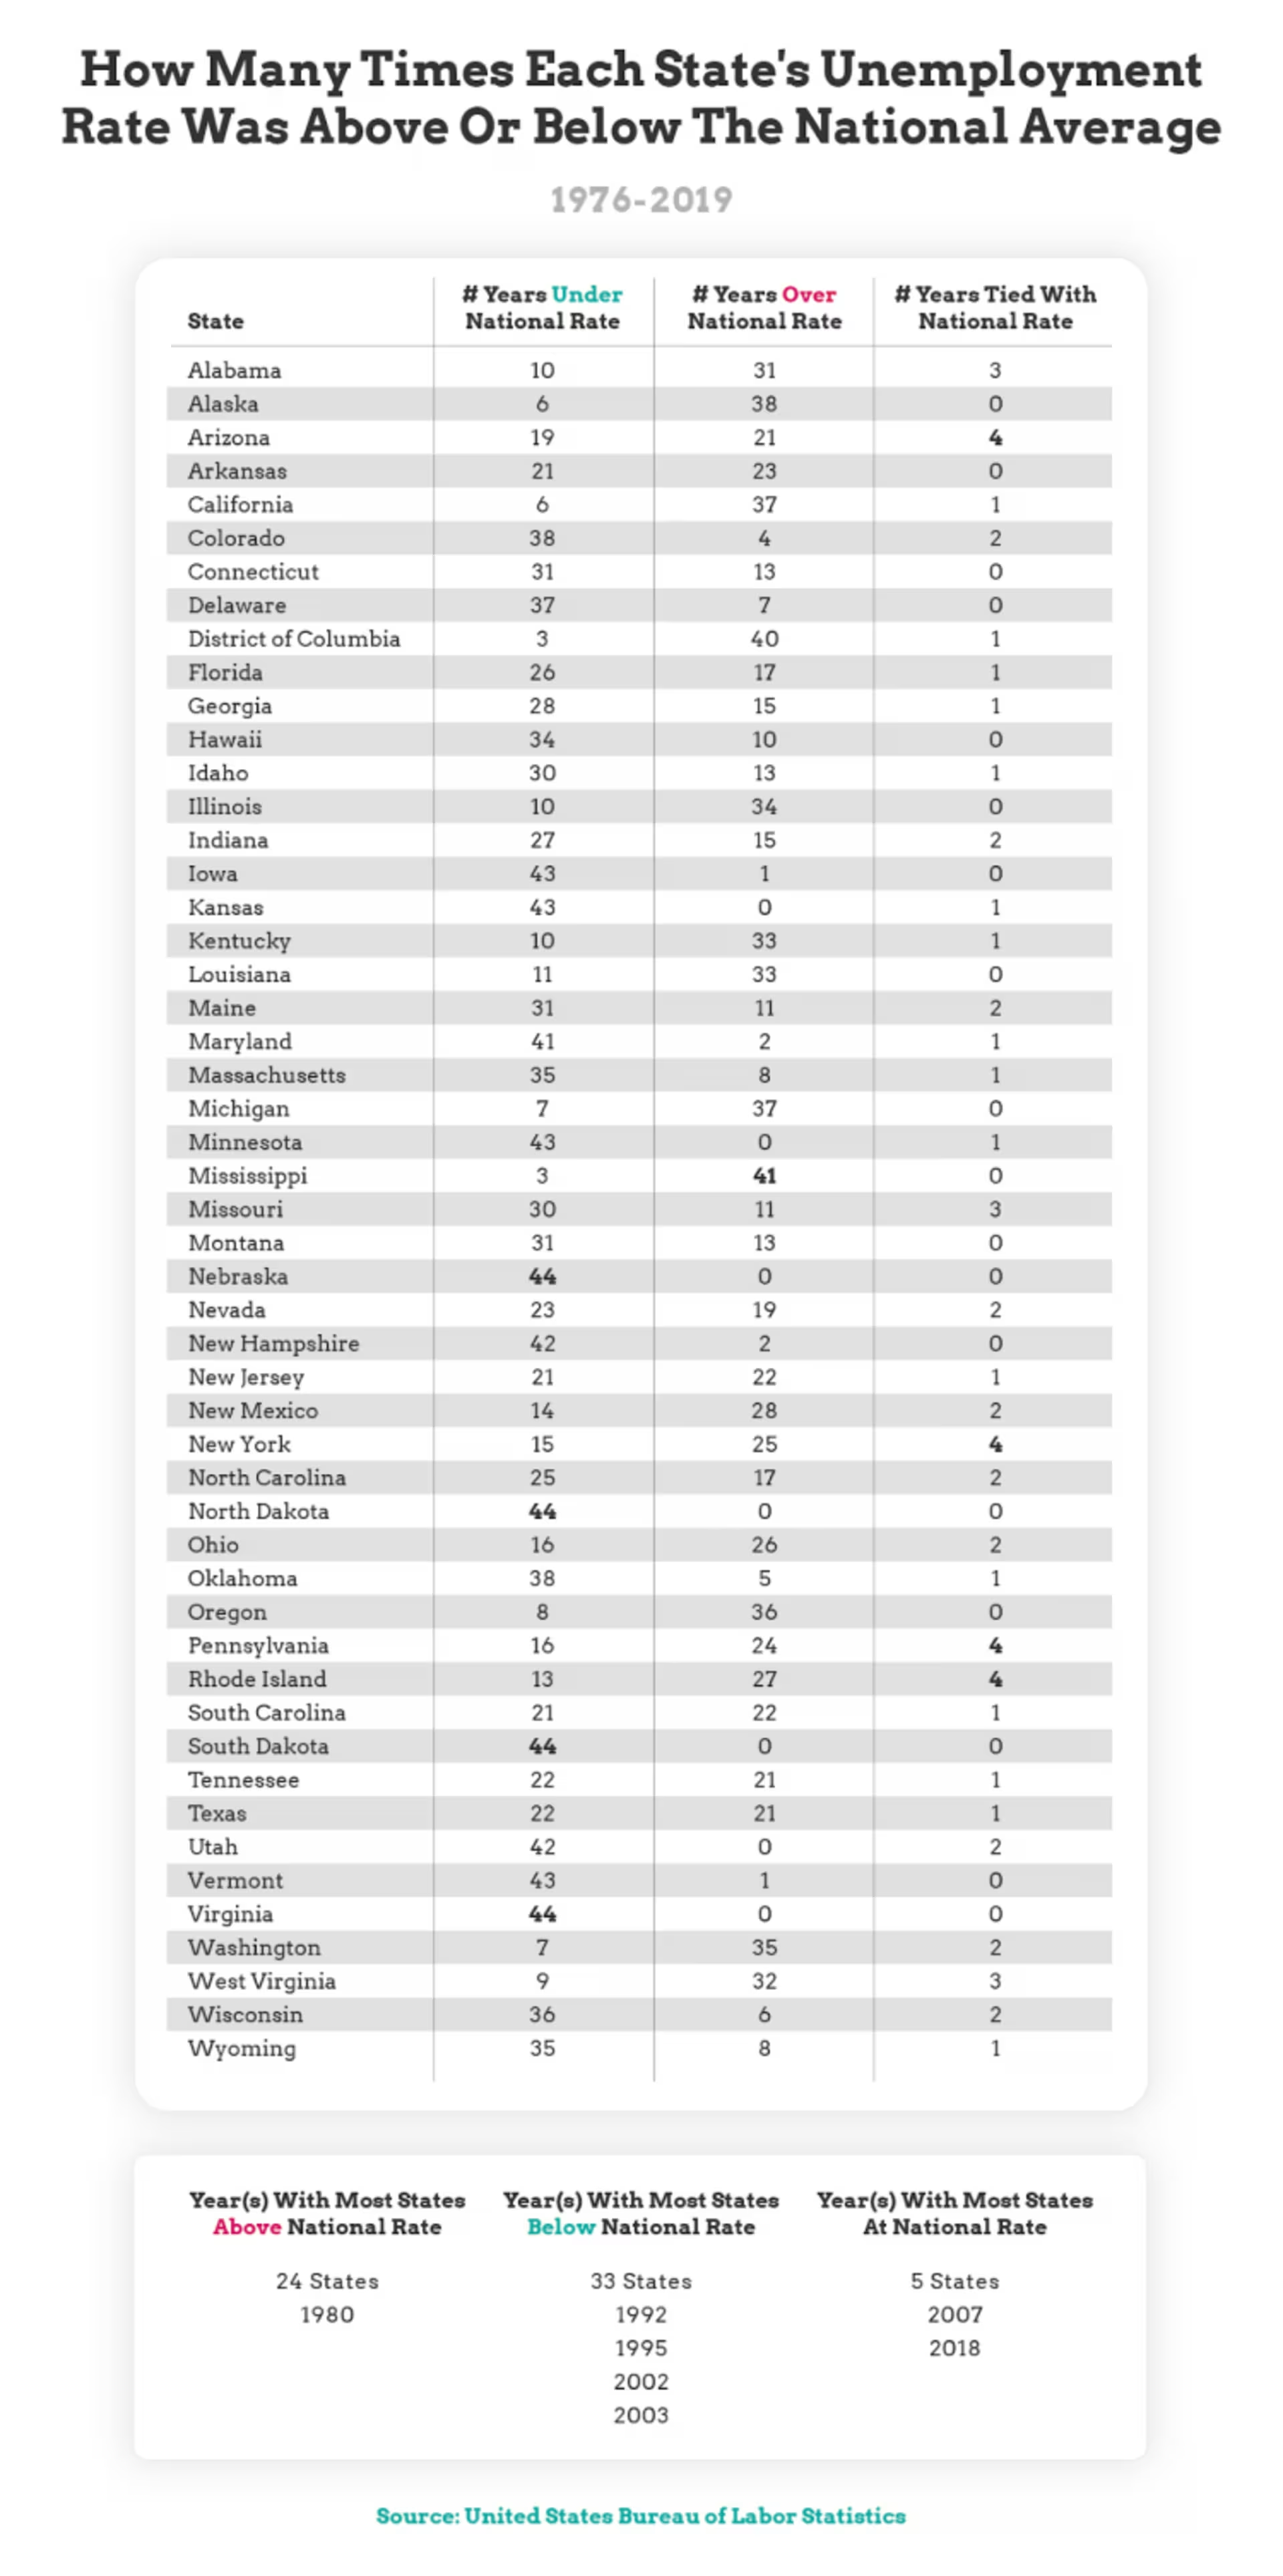
We also tracked how many times each state’s unemployment rate was above, below or tied with the national average and charted out the results above. In the 44-year time period evaluated, four states had unemployment rates below the national average every single year – Nebraska, Virginia and both Dakotas. On the flip side, Mississippi is the state where unemployment rates were consistently higher than average, as they were above the rest of the country’s average 41 out of 44 years.
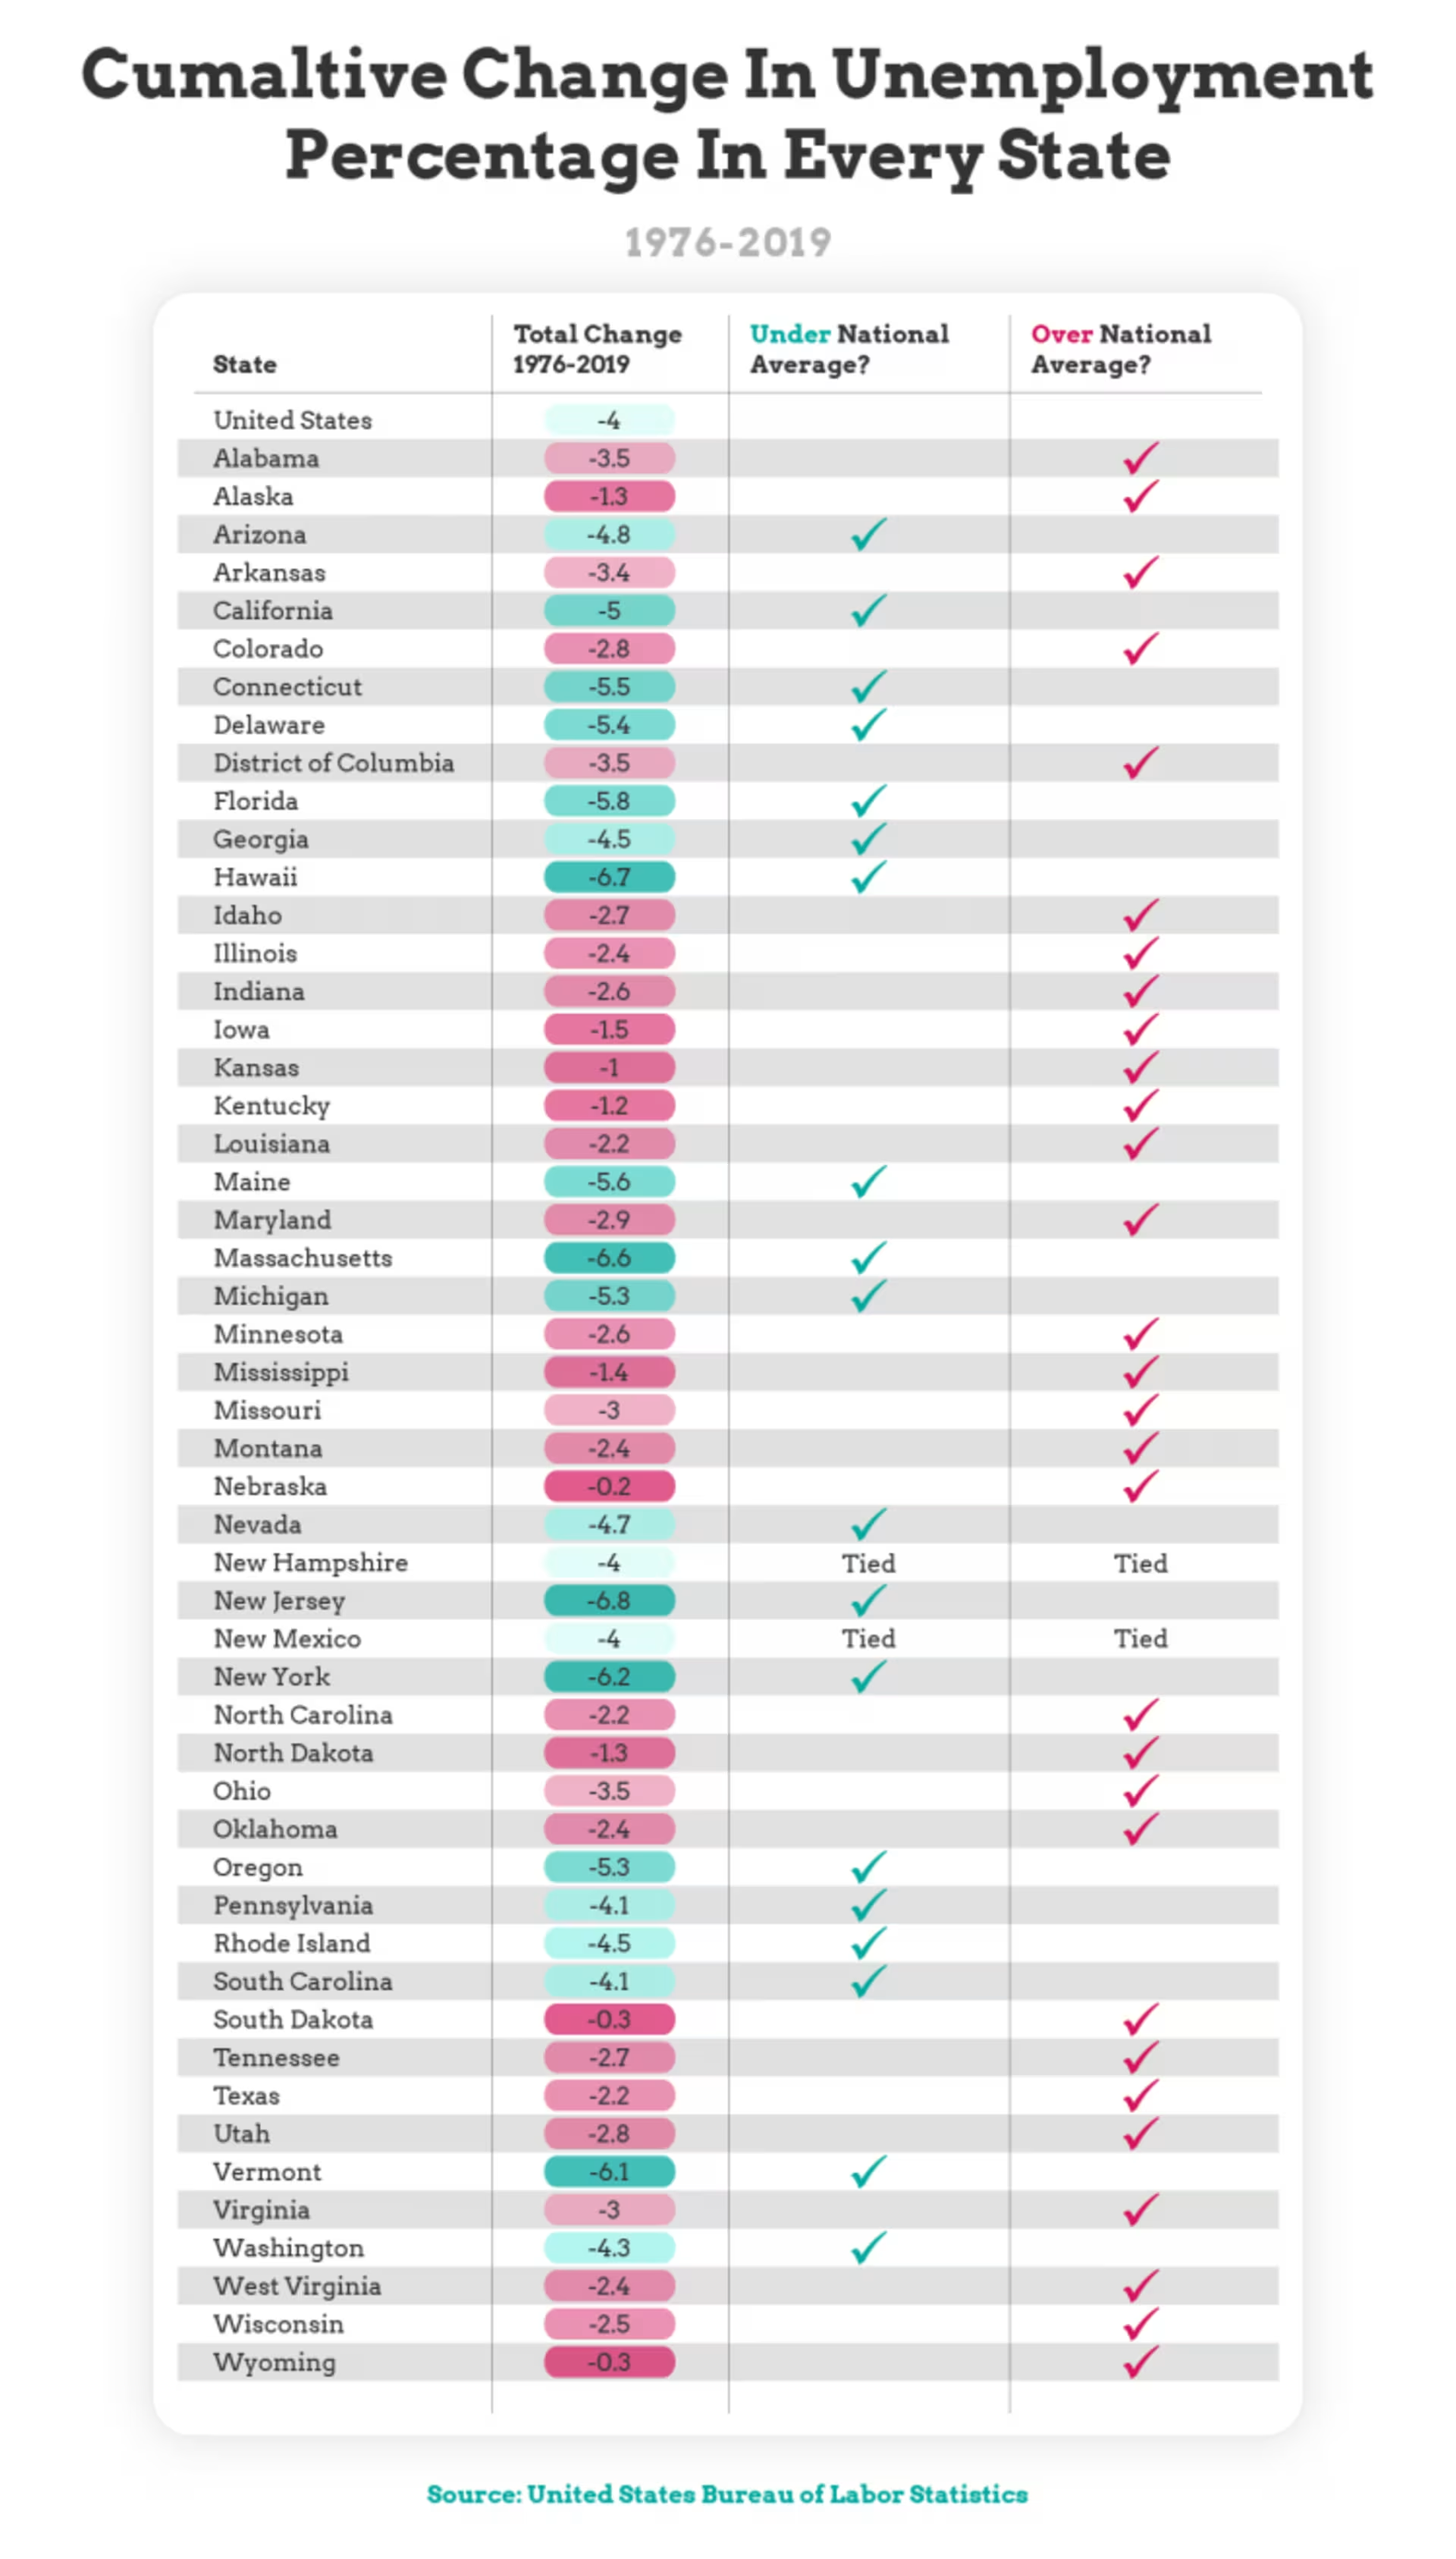